mitigating bufferbloat
Tl;DR
When I upload something large from my laptop my network latency
increases from 10 milliseconds up to 2-4 seconds. That makes
remote ssh, audio, video and even browsing quite a challenging task. I
avoid latency increase and network congestion by aggressively throttling
all my devices with this simple command from CAKE
howto:
# tc qdisc del dev wl0 root
# tc qdisc add dev wl0 root cake bandwidth 1mbit conservative
Done! Now I almost never notice latency increase even if I upload A Lot of stuff.
More words
If you are experiencing severe networking lags (10x latency
increase) when network is congested then you probably experience a
bufferbloat effect where
networking devices keep your packets in their large software/hardware
queues.
These queues can hide anywhere: in your own networking card(!), in your
Wifi router, somewhere in the middle of The Internet. It is a bug in
the implementation of those devices.
Excessive buffering usually happens on a last mile of your device
connected to ISP. ISPs usually have a lot more bandwidth and
smarter devices to avoid that effect.
Observing bufferbloat
Before doing anything about it let’s check if we have a problem:
$ ping 8.8.8.8
64 bytes from 8.8.8.8: icmp_seq=1 ttl=54 time=8.53 ms
64 bytes from 8.8.8.8: icmp_seq=2 ttl=54 time=18.1 ms
64 bytes from 8.8.8.8: icmp_seq=3 ttl=54 time=9.47 ms
64 bytes from 8.8.8.8: icmp_seq=4 ttl=54 time=14.1 ms
...
In a second terminal I start an upload:
$ scp /boot/vmlinuz slyfox@guppy.ia64.dev.gentoo.org:/tmp/my-kernel
vmlinuz 99% 7968KB 119.1KB/s   00:00 ETA
Back in the first terminal:
...
64 bytes from 8.8.8.8: icmp_seq=100 ttl=54 time=116 ms
64 bytes from 8.8.8.8: icmp_seq=101 ttl=54 time=141 ms
64 bytes from 8.8.8.8: icmp_seq=102 ttl=54 time=192 ms
64 bytes from 8.8.8.8: icmp_seq=103 ttl=54 time=188 ms
64 bytes from 8.8.8.8: icmp_seq=104 ttl=54 time=182 ms
64 bytes from 8.8.8.8: icmp_seq=105 ttl=54 time=218 ms
64 bytes from 8.8.8.8: icmp_seq=166 ttl=54 time=223 ms
64 bytes from 8.8.8.8: icmp_seq=167 ttl=54 time=230 ms
64 bytes from 8.8.8.8: icmp_seq=168 ttl=54 time=232 ms
64 bytes from 8.8.8.8: icmp_seq=169 ttl=54 time=8.66 ms <--- recovered
64 bytes from 8.8.8.8: icmp_seq=170 ttl=54 time=9.21 ms
64 bytes from 8.8.8.8: icmp_seq=171 ttl=54 time=8.79 ms
64 bytes from 8.8.8.8: icmp_seq=172 ttl=54 time=9.02 ms
64 bytes from 8.8.8.8: icmp_seq=173 ttl=54 time=10.2 ms
You can notice where upload started and finished just by looking at the ping latency output. There is a nice interactive website where you can profile your network in a slightly more rigorous way: https://www.dslreports.com/speedtest My profile on default system: https://www.dslreports.com/speedtest/62838367
We can see a bunch of things outright:
16.5 mbit/sdownload and0.96 mbit/supload speed26msof idle latency (to closest test server perhaps)- latency increases a bit when I congest network with download:
26ms->70ms(100msworst case) - latency increases A Lot when I congest network with upload:
26ms->~1s(~2.6sworst case)
These were my defaults during first test:
$ tc qdisc show dev wl0
qdisc mq 0: root
qdisc fq_codel 0: parent :4 limit 10240p flows 1024 quantum 1514 target 5.0ms interval 100.0ms memory_limit 32Mb ecn
qdisc fq_codel 0: parent :3 limit 10240p flows 1024 quantum 1514 target 5.0ms interval 100.0ms memory_limit 32Mb ecn
qdisc fq_codel 0: parent :2 limit 10240p flows 1024 quantum 1514 target 5.0ms interval 100.0ms memory_limit 32Mb ecn
qdisc fq_codel 0: parent :1 limit 10240p flows 1024 quantum 1514 target 5.0ms interval 100.0ms memory_limit 32Mb ecn
Now let’s artificially limit egress (outgoing) bandwidth:
# tc qdisc del dev wl0 root
# tc qdisc add dev wl0 root cake bandwidth 1mbit conservative
and retest again: https://www.dslreports.com/speedtest/62838672
Things changed:
- Speeds decreased slightly:
16.1 mbit/supload,0.811 mbit/sdownload. Mostly because I setconservativekeyword to account for worst encapsulation overhead. You can experiment with more fine-grained values, but I don’t mind the result. - Download congestion can still impact latency increase. For some reason
it’s more pronounced now:
140msworst. - Upload congestion has almost no effect on latency! Average is
34ms, worst is70ms!
Now let’s also try artificially limiting ingress:
#### egress as before
# tc qdisc del dev wl0 root
# tc qdisc add dev wl0 root cake bandwidth 1mbit conservative

#### ingress, a bit kludgy
# ip link add name ifb4wl0 type ifb
# tc qdisc del dev wl0 ingress
# tc qdisc add dev wl0 handle ffff: ingress
# tc qdisc del dev ifb4wl0 root
# tc qdisc add dev ifb4wl0 root cake bandwidth 16mbit conservative
# ip link set ifb4wl0 up
# tc filter add dev wl0 parent ffff: protocol all prio 10 u32 match u32 0 0 flowid 1:1 action mirred egress redirect dev ifb4wl0
and retest again: https://www.dslreports.com/speedtest/62838933
- Speeds decreased even more:
11.27 mbit/supload,0.766 mbit/sdownload. I think the drastic drops upset TCP and it can’t recover faster. - Download congestion did not become any better. That might be a sign of
bufferbloaton ISP side. - Upload congestion is still good.
If you rerun the test you will notice that numbers will change from run to run in order of 10-20% (or more). This will not allow you to fine-tune the setup but is good enough to observe the effect.
More fine-grained testing
To get better numbers bufferbloat.net project suggests using
flent command line tool.
For that you will need a peer host to talk to. I’m picking
guppy.ia64.dev.gentoo.org 140ms (half a globe) away from me.
Here is the run on default qdisc:
#### remotely
guppy / # netserver -D

#### locally
localhost # tc qdisc show dev wl0
qdisc mq 0: root
qdisc fq_codel 0: parent :4 limit 10240p flows 1024 quantum 1514 target 5.0ms interval 100.0ms memory_limit 32Mb ecn
qdisc fq_codel 0: parent :3 limit 10240p flows 1024 quantum 1514 target 5.0ms interval 100.0ms memory_limit 32Mb ecn
qdisc fq_codel 0: parent :2 limit 10240p flows 1024 quantum 1514 target 5.0ms interval 100.0ms memory_limit 32Mb ecn
qdisc fq_codel 0: parent :1 limit 10240p flows 1024 quantum 1514 target 5.0ms interval 100.0ms memory_limit 32Mb ecn

localhost # flent rrul -p all_scaled -l 60 -H guppy.ia64.dev.gentoo.org -t def-to-guppy -o def-filename.png
Started Flent 1.0.1 using Python 3.6.10.
Starting rrul test. Expected run time: 70 seconds.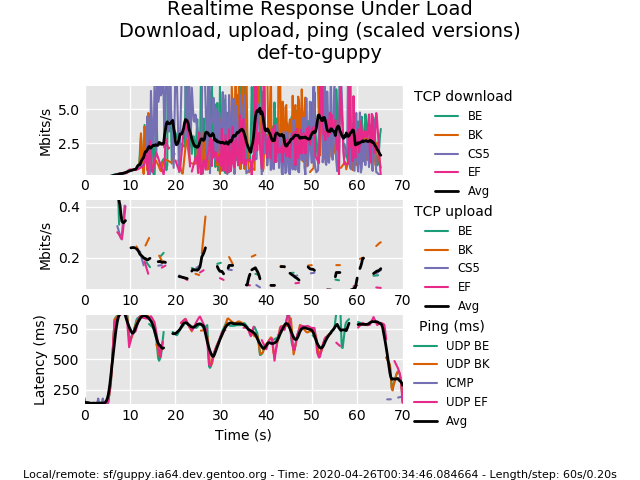
There are 3 graphs:
- download speed: jumps around
2.5-5 mbit/s. - uplaod speed: very unstable, hard to say anything :)
- latency graph: almost always
750ms, sometimes touches500ms
Here is the run with cake both on ingress and egress:
#### remotely
guppy / # netserver -D

#### locally
localhost # tc qdisc show dev wl0
qdisc cake 800f: root refcnt 5 bandwidth 1Mbit diffserv3 triple-isolate nonat nowash no-ack-filter split-gso rtt 100.0ms atm overhead 48
qdisc ingress ffff: parent ffff:fff1 ----------------

localhost # flent rrul -p all_scaled -l 60 -H guppy.ia64.dev.gentoo.org -t cake-to-guppy -o cake-filename.png
Started Flent 1.0.1 using Python 3.6.10.
Starting rrul test. Expected run time: 70 seconds.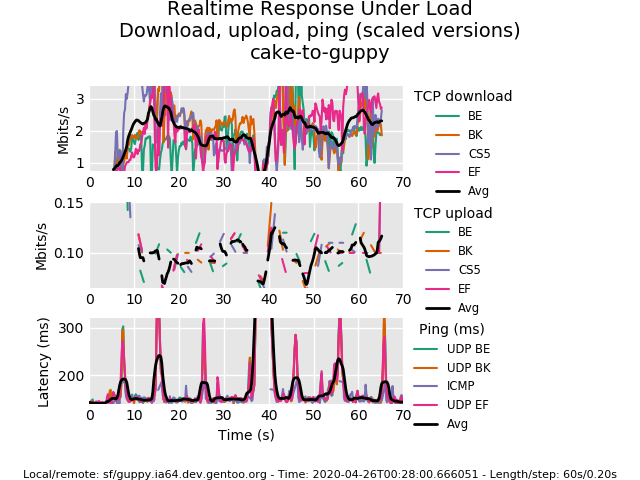
3 graphs again:
- download speed: jumps around
2-3 mbit/s. - uplaod speed: looks like
0.1mbit/s? - latency graph: most of the time
170ms, sometimes spikes up to300ms
Even though data is still quite noisy we can see that latency is lower
in the second case.
Picking closer host and running test for longer time might yield more
precise data.
Now you can tweak many more parameters to see what changes for better or
worse: TCP congestion algorithms (I use bbr), many tweaks on man tc-cake’s side and many more.
I suggest skimming through more resources at
https://www.bufferbloat.net/projects/ if you are interested in the
topic.
Final test
Let’s get back to our original test (with ingress/egress cake
enabled this time):
$ ping 8.8.8.8
64 bytes from 8.8.8.8: icmp_seq=1 ttl=54 time=9.31 ms
64 bytes from 8.8.8.8: icmp_seq=2 ttl=54 time=9.20 ms
64 bytes from 8.8.8.8: icmp_seq=3 ttl=54 time=8.37 ms
64 bytes from 8.8.8.8: icmp_seq=4 ttl=54 time=10.6 ms
...
In a second terminal start uploader:
$ scp /boot/vmlinuz slyfox@guppy.ia64.dev.gentoo.org:/tmp/my-kernel
vmlinuz 99% 7968KB 104.6KB/s   00:00 ETA
...
Back in the first terminal:
...
64 bytes from 8.8.8.8: icmp_seq=178 ttl=54 time=16.5 ms
64 bytes from 8.8.8.8: icmp_seq=179 ttl=54 time=14.8 ms
64 bytes from 8.8.8.8: icmp_seq=180 ttl=54 time=15.4 ms
64 bytes from 8.8.8.8: icmp_seq=181 ttl=54 time=10.0 ms
64 bytes from 8.8.8.8: icmp_seq=182 ttl=54 time=20.3 ms
64 bytes from 8.8.8.8: icmp_seq=183 ttl=54 time=9.16 ms
64 bytes from 8.8.8.8: icmp_seq=184 ttl=54 time=9.71 ms
64 bytes from 8.8.8.8: icmp_seq=185 ttl=54 time=17.5 ms
64 bytes from 8.8.8.8: icmp_seq=186 ttl=54 time=13.0 ms
64 bytes from 8.8.8.8: icmp_seq=224 ttl=54 time=19.9 ms
64 bytes from 8.8.8.8: icmp_seq=225 ttl=54 time=42.3 ms
64 bytes from 8.8.8.8: icmp_seq=226 ttl=54 time=13.3 ms
64 bytes from 8.8.8.8: icmp_seq=227 ttl=54 time=8.39 ms
64 bytes from 8.8.8.8: icmp_seq=230 ttl=54 time=11.4 ms
64 bytes from 8.8.8.8: icmp_seq=231 ttl=54 time=8.84 ms <--- recovered
64 bytes from 8.8.8.8: icmp_seq=232 ttl=54 time=8.63 ms
64 bytes from 8.8.8.8: icmp_seq=233 ttl=54 time=8.49 ms
Latency increased a bit from 10ms to ~20ms. But it does not get to
300ms. Yay!
Have fun!