seekwatcher 0.14
About 10 years ago I tried out
seekwatcher for the first time (unfortunately past videos and
pictures did not survive host migrations). There I explored slowness of
btrfs on my spinning drive and concluded IO was seek-bound.
Believe it or not seekwatcher code did not change at all since then.
It was abandoned upstream in favor of iowatcher:
http://masoncoding.com/iowatcher/. I never knew there was a
replacement and kept tweaking seekwatcher for minor failures like
dash incompatibilities. Eventually (8 years later) I released the
result as 0.13. Looking at it 2 years later effectively nobody uses
0.13: https://repology.org/project/seekwatcher/versions. This is
fine. Most distributions effectively abandoned seekwatcher or never
had it packages in the first place. I myself did not have a reason to
use it for years and did not notice it’s build broke again.
I spent this weekend to refurbish it a bit. The result is a new 0.14
release! It
should be able to run on modern Python 3.10 (and something less modern
as well).
As a demo today’s video and picture will be a read-only workload for
btrfs scrub against a 35% filled root SSD partition for my desktop:
$ seekwatcher -t scrub.trace -p 'echo 3 > /proc/sys/vm/drop_caches; sync; btrfs scrub start -B /' -d /dev/nvme0n1p3
$ seekwatcher -t scrub.trace -o scrub.ogg --movie
$ seekwatcher -t scrub.trace -o scrub.png
The output of the above commands is also instructive:
$ blktrace -d /dev/nvme0n1p3 -o scrub.trace -D . -a queue -a complete -a issue
running :echo 3 > /proc/sys/vm/drop_caches; sync; btrfs scrub start -B /:
scrub done for 6b160f29-1dbb-4020-a36d-c233f1dffaf6
Scrub started:    Mon Jan 17 07:52:29 2022
Status:           finished
Duration:         0:01:08
Total to scrub:   404.02GiB
Rate:             2.17GiB/s
Error summary:    no errors found
done running echo 3 > /proc/sys/vm/drop_caches; sync; btrfs scrub start -B /
=== nvme0n1p3 ===
  CPU  0:               876508 events,    41087 KiB data
  CPU  1:               693423 events,    32505 KiB data
  CPU  2:               537656 events,    25203 KiB data
  CPU  3:               592174 events,    27759 KiB data
  CPU  4:               511254 events,    23966 KiB data
  CPU  5:               495733 events,    23238 KiB data
  CPU  6:               503972 events,    23624 KiB data
  CPU  7:               593066 events,    27800 KiB data
  CPU  8:               783384 events,    36722 KiB data
  CPU  9:               626492 events,    29367 KiB data
  CPU 10:               938655 events,    44000 KiB data
  CPU 11:               815019 events,    38205 KiB data
  CPU 12:               765571 events,    35887 KiB data
  CPU 13:               603239 events,    28277 KiB data
  CPU 14:               813953 events,    38155 KiB data
  CPU 15:               686623 events,    32186 KiB data
  Total:              10836722 events (dropped 0),   507972 KiB data
blktrace done

using tracefile ./scrub.trace
saving graph to trace.png
using tracefile ./scrub.trace
total frames is 300 secs per frame = 0.23

start 0.00 secs end 0.23 secs frame 0
start 0.23 secs end 0.46 secs frame 1
start 0.46 secs end 0.68 secs frame 2
start 0.68 secs end 0.91 secs frame 3
start 0.91 secs end 1.14 secs frame 4
...
MEncoder 1.4-10.3.0 (C) 2000-2019 MPlayer Team
...
Note that seekwatcher is a wrapper around blktrace and
mencoder: it’s main job is to build a 30-second clip off any data
by downsampling things. Here is the result of the above commands:
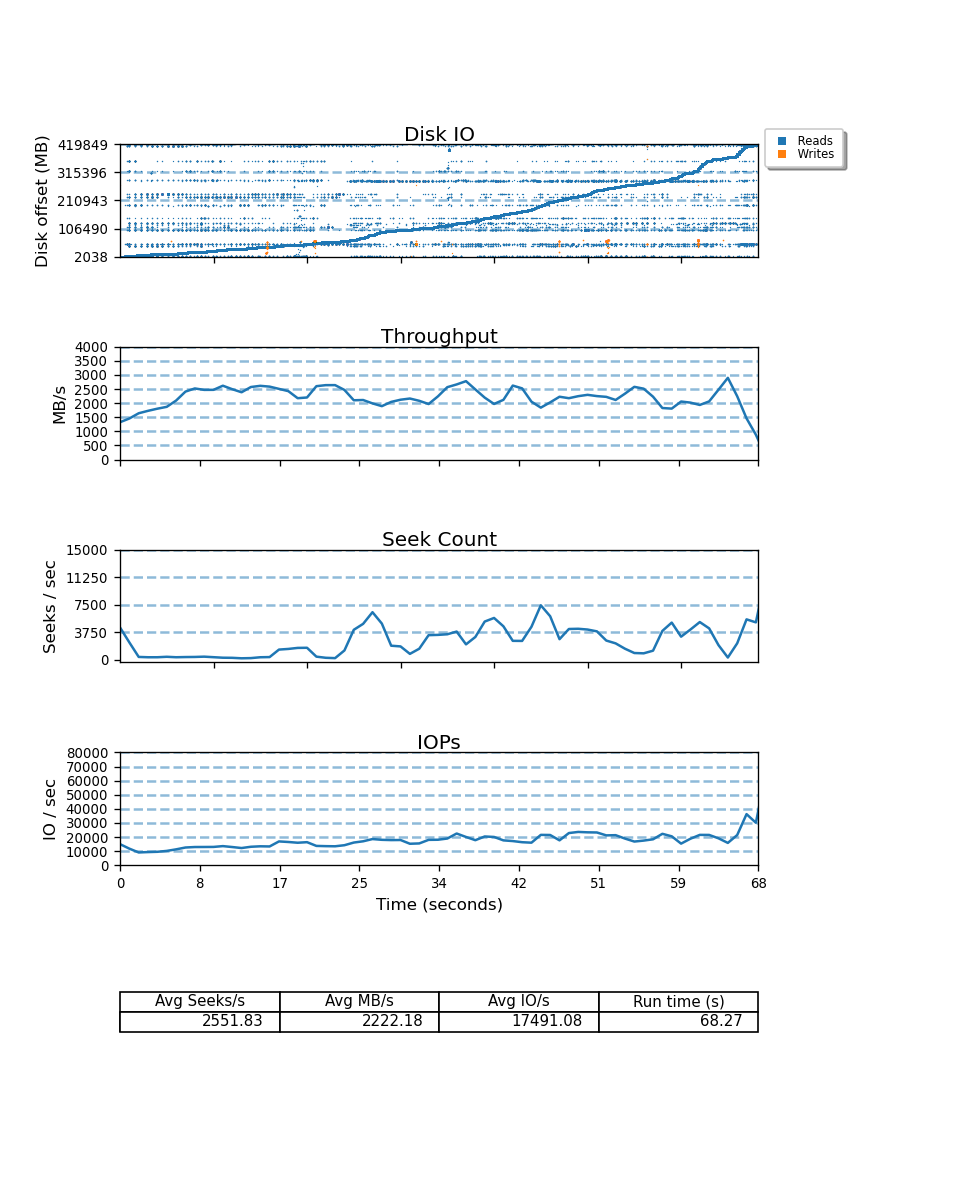
The average read speed is 2.2GB/s with 17K IO/s of them seeks are
2.5K/s. The equivalent iowatcher commands should look identical.
That’s it!